S-curve
The functionality is available in PRO Edition only
PROAn s-curve tracks cumulative project progress as one or more lines over the chart area, each rising from 0% to 100% across the project's span.
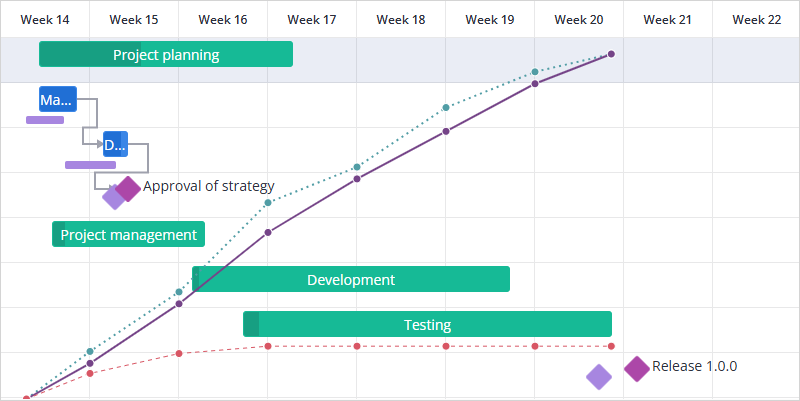
Enable an s-curve
Set the sCurve property to true to draw a single earned curve weighted by task duration:
import { Gantt } from "@svar/react-gantt";
import { getData } from "./data";

const { tasks, links, scales } = getData();

export default function Example() {
  return <Gantt tasks={tasks} links={links} scales={scales} sCurve />;
}
Pass an array instead to draw several curves at once:
<Gantt
  tasks={tasks}
  links={links}
  scales={scales}
  sCurve={[
    { type: "baseline" },
    { type: "scheduled" },
    { type: "earned" },
  ]}
/>
Compare baseline, scheduled, and earned
Each type draws from a different set of dates:
"scheduled"- the livestart/endfields of every task"baseline"- thebase_start/base_endfields you configure via baselines"earned"- the same live dates as"scheduled", but each task contributes only its progress share
Show all three curves together to see the project's health at a glance. The horizontal gap between "baseline" and "scheduled" shows how far the schedule has slipped from the original plan. The vertical gap between "scheduled" and "earned" shows how much work is still outstanding.
Turn on baselines and give tasks a base_start to feed the "baseline" curve:
import { Gantt } from "@svar/react-gantt";
import { getData } from "./data";

const data = getData();
const { links, scales } = data;

const tasks = data.tasks.map(task => {
  if (!task.start || task.type === "summary") return task;
  return {
    ...task,
    base_start: new Date(new Date(task.start).setDate(task.start.getDate() - 2)),
    base_duration: task.duration,
  };
});

export default function Example() {
  return (
    <Gantt
      tasks={tasks}
      links={links}
      scales={scales}
      baselines
      sCurve={[
        { type: "baseline" },
        { type: "scheduled" },
        { type: "earned" },
      ]}
    />
  );
}
In this example, every task's baseline starts two days ahead of its live schedule, except for summary tasks. Summary tasks never contribute to any s-curve line, so the snippet leaves base_start unset for that type.
Weight tasks by duration or progress
Use metric to control how much each task moves a curve:
"duration"(default) - a task weighs the curve by its working time, so a 10-day task moves the curve ten times as much as a 1-day one"progress"- every task weighs the curve equally, regardless of length
<Gantt
  tasks={tasks}
  links={links}
  scales={scales}
  sCurve={[{ type: "earned", metric: "progress" }]}
/>
Switch to "progress" when you want every task, long or short, to carry the same weight in the curve, for example on a checklist-style project where task count matters more than duration.
Toggle curves and metrics at runtime
Build the sCurve array from state to let users turn individual curves on or off and switch their metric without reloading the chart:
import { useState, useMemo } from "react";
import { Gantt } from "@svar/react-gantt";
import { getData } from "./data";

const { tasks, links, scales } = getData();

export default function Example() {
  const [config, setConfig] = useState({
    baseline: { on: true, metric: "duration" },
    scheduled: { on: true, metric: "duration" },
    earned: { on: true, metric: "duration" },
  });

  const sCurve = useMemo(
    () =>
      Object.entries(config)
        .filter(([, line]) => line.on)
        .map(([type, line]) => ({ type, metric: line.metric })),
    [config]
  );

  function update(type, changes) {
    setConfig(prev => ({ ...prev, [type]: { ...prev[type], ...changes } }));
  }

  return (
    <>
      {Object.keys(config).map(type => (
        <div key={type}>
          <label>
            <input
              type="checkbox"
              checked={config[type].on}
              onChange={e => update(type, { on: e.target.checked })}
            />
            {type}
          </label>
          <select
            value={config[type].metric}
            disabled={!config[type].on}
            onChange={e => update(type, { metric: e.target.value })}
          >
            <option value="duration">By duration</option>
            <option value="progress">By progress</option>
          </select>
        </div>
      ))}

      <Gantt tasks={tasks} links={links} scales={scales} sCurve={sCurve} />
    </>
  );
}
Gantt redraws the curves as soon as sCurve changes, so unchecking a curve removes its line right away.
Style individual curves
Pass a css class in a curve config to replace its default line style:
import { Gantt } from "@svar/react-gantt";
import { getData } from "./data";
import "./SCurve.css";

const { tasks, links, scales } = getData();

export default function Example() {
  return (
    <Gantt
      tasks={tasks}
      links={links}
      scales={scales}
      sCurve={[
        { type: "baseline", css: "sc-baseline" },
        { type: "scheduled", css: "sc-scheduled" },
        { type: "earned", css: "sc-earned" },
      ]}
    />
  );
}
/* SCurve.css */
.wx-willow-theme .sc-baseline { stroke: #9e9e9e; }
.wx-willow-theme .sc-scheduled { stroke: #2196f3; }
.wx-willow-theme .sc-earned { stroke: #4caf50; }
Control which tasks contribute
A task needs at least start date to contribute to a curve. Summary tasks, milestones, unscheduled tasks, and inactive tasks don't contribute. A plain task with subtasks still counts, alongside its children.
Calendars add a second, finer-grained filter: even for a task that counts, its weight only lands in the cells its calendar marks as working. Gantt uses the task's own calendar if it has one, otherwise the Gantt-wide calendar. With no calendar configured, every cell counts as working.
Set a Gantt-wide calendar with no working hours on weekends to flatten every curve there:
import { Gantt } from "@svar/react-gantt";
import { getData } from "./data";

const { tasks, links, scales } = getData();

const calendar = {
  weekHours: {
    monday: 8,
    tuesday: 8,
    wednesday: 8,
    thursday: 8,
    friday: 8,
    saturday: 0,
    sunday: 0,
  },
};

export default function Example() {
  return (
    <Gantt
      tasks={tasks}
      links={links}
      scales={scales}
      calendar={calendar}
      sCurve
    />
  );
}
With no working hours on Saturday and Sunday, every curve stays flat across the weekend regardless of metric.
For a split task, the weight follows the segments. Gaps between segments stay flat on the curve.
Set the curve span
By default, Gantt draws curves between the earliest and latest dates that contribute to any line, baseline dates included. To fix the span regardless of task dates, set projectStart and projectEnd:
<Gantt
  tasks={tasks}
  links={links}
  scales={scales}
  sCurve={[{ type: "scheduled" }, { type: "earned" }]}
  projectStart={new Date(2024, 3, 1)}
  projectEnd={new Date(2024, 3, 30)}
/>
Within that span, a line stays flat at 0% before its first contribution and flat at its total after the last.
Related sample:
Related articles:
- sCurve property
- Baselines
- Calendars
- Progress line
- projectStart property
- projectEnd property
- Adding tooltips