SVAR React Gantt Overview
SVAR React Gantt is a Gantt chart component for building interactive project management and scheduling applications. It is written entirely in React, ensuring a lightweight architecture and seamless integration with React apps, with full TypeScript support.
The component provides a flexible API for building task management tools, from simple timelines to complex project planning interfaces. The open-source core offers essential functionality such as task management, dependencies, drag-and-drop timeline editing, and configurable UI.
For advanced scheduling scenarios, SVAR React Gantt PRO extends the component with enterprise-grade features including critical path calculation, baselines, auto-scheduling, working calendars, rollups, time markers, and data export (MS Project, etc).
SVAR React Gantt is optimized for performance with large datasets. It uses efficient rendering and dynamic data handling to support complex timelines, with demo showcasing smooth rendering of 10,000 tasks.
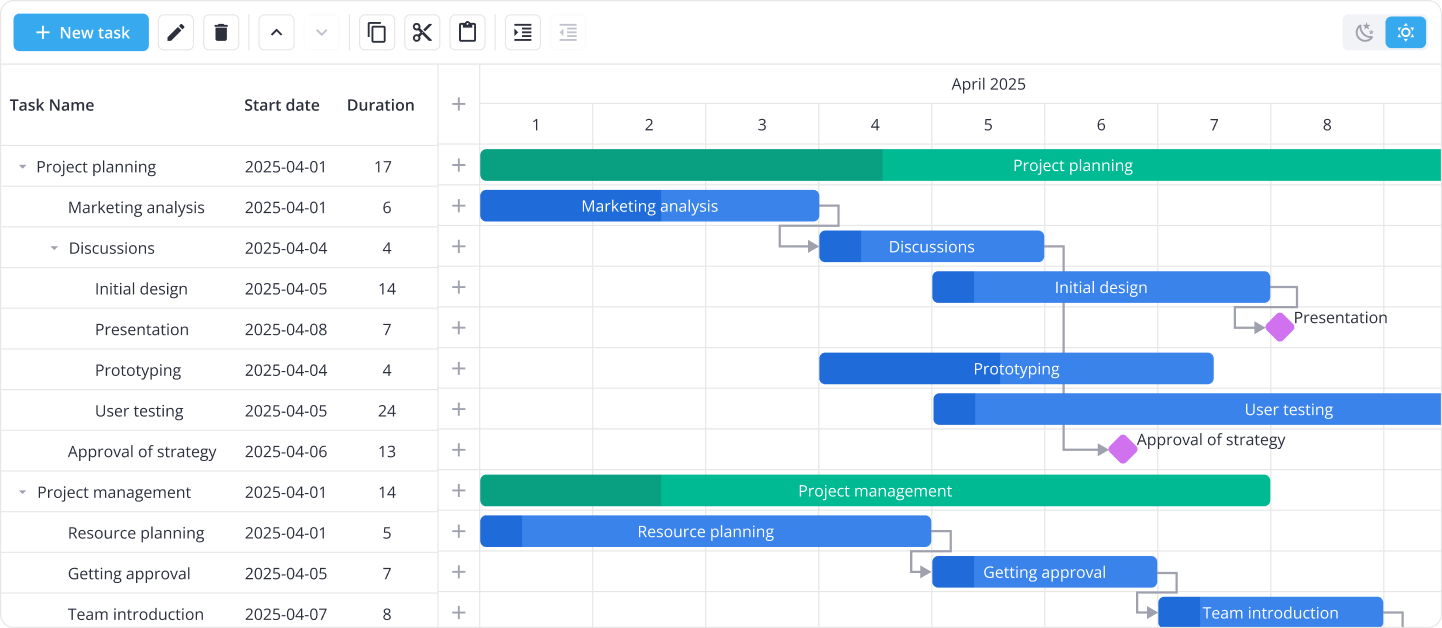
The component includes light and dark themes and supports full UI customization, from time scales to task bars and task edit form. The image below shows SVAR React Gantt with integrated toolbar:
License
SVAR React Gantt is available under two options:
- Open-source edition (MIT): The core of SVAR React Gantt is open-source, available under the MIT license.
- PRO edition: Adds advanced features (marked with | PRO feature in the documentation) and is available under commercial licenses. See pricing details or request a free trial.
Key features
Here is the list of the most required features supported by SVAR React Gantt:
Project planning
- Summary tasks and milestones
- Automatic summary task progress calculation | PRO feature
- Automatic conversion between regular and summary tasks | PRO feature
- Task dependencies: end-to-start, start-to-start, end-to-end, start-to-end
- Hierarchical view of sub-tasks
- Auto-scheduling (forward mode, Finish-to-Start) | PRO feature
- Unscheduled tasks | PRO feature
- Critical path calculation and slack visualization | PRO feature
- Global calendar | PRO feature
- Baselines | PRO feature
- Handling of invalid links | PRO feature
- Rollups | PRO feature
Task management
- Adding tasks via an action column
- Context menu and toolbar with common operations
- Dragging and resizing tasks on the chart
- Dragging tasks to reorder
- Editing task dependencies and progress on the chart
- Editing tasks using inline editors or standalone form
- Filtering data (including natural language filter, query syntax, and powerful query builder)
- Sorting tasks by clicking column headers
- Split tasks | PRO feature
- WBS codes | PRO feature
Resource management
- Assigning resources to tasks | PRO feature
- Grouping tasks by resources | PRO feature
- Per-task and per-resource calendars | PRO feature
- Workload calculation | PRO feature
User experience
- Compact mode for smaller screens
- Hotkeys
- Resizing, hiding and showing Gantt parts (chart, grid)
- Task tooltips
- Undo and redo actions | PRO feature
- Vertical markers on timeline | PRO feature
- Zooming (default and custom levels)
Configuration
- Custom scale lines and units
- Duration units: hour, day
- Fixed or flexible scale boundaries
- Fullscreen mode
- Highlighting weekends and holidays
- Length units from minute to year
- Light and dark themes
- Localization
- Readonly mode
- Setting scale width, height, borders
- Styling with CSS variables
- Templates for grid cells and task bars
Data handling & performance
- Fast performance with large data sets
- Dynamic loading of sub-tasks
- API to listen, intercept and execute data operations
- Server-side export to PDF, PNG, Excel | PRO feature
- Client-side import and export of MS Project XML | PRO feature
RestDataProviderfor backend data binding
Next steps
- Read getting started guide
- Browse API documentation
- Explore Gantt demos with code examples references on GitHub