Resource load
The functionality is available in PRO Edition only
The ResourceLoad component renders a time grid alongside the Gantt chart. Each row represents a resource; each column a time period defined by the Gantt scale. Cells show the hours allocated in that period and are color-coded by load (≤ 100%) and overloaded (> 100%).
The Gantt chart and the resource grid share the same date range, scale, and highlightTime settings, so weekends and holidays are tinted consistently across both.
Rows also support native dragging via draggableRows, so users can assign a resource by dragging it out of the workload grid onto a task. Refer to Drag from the resource load view.
Basic setup
Mount ResourceLoad next to your Gantt and pass the same api reference to both. The two components stay in sync through the shared API:
<script setup>
  import { Gantt, ResourceLoad } from "@svar/vue-gantt";
  import { ref } from "vue";

  const api = ref(null);
</script>

<template>
  <Gantt ref="api" :tasks="tasks" :links="links" :scales="scales" :resources="resources" :assignments="assignments" />
  <ResourceLoad :api="api" />
</template>
Columns
By default ResourceLoad shows the Resources name column, Hours total column, and Capacity column. Pass a custom columns array to override placement, widths, or add extra columns:
<script setup>
  const columns = [
    { id: "name", header: "Team member", flexgrow: 1, sort: true, resize: true },
    { id: "role", header: "Role", width: 120 },
    { id: "total", header: "Total h", width: 80, align: "center", getter: row => row.$total, },
  ];
</script>

<template>
  <ResourceLoad :api="api" :columns="columns" />
</template>
For the full list of column options, see ResourceLoad component.
Cell display
Each cell shows allocated hours by default (e.g., 8h). Pass the template function to change the format:
<!-- Show percent instead of hours -->
<ResourceLoad :api="api" :template="load => `${load.percent}%`" />

<!-- Show both -->
<ResourceLoad :api="api" :template="load => `${load.hours}h (${load.percent}%)`" />
For the full template and load object description, see ResourceLoad component.
Display mode
ResourceLoad supports two display modes that can be set via the mode prop:
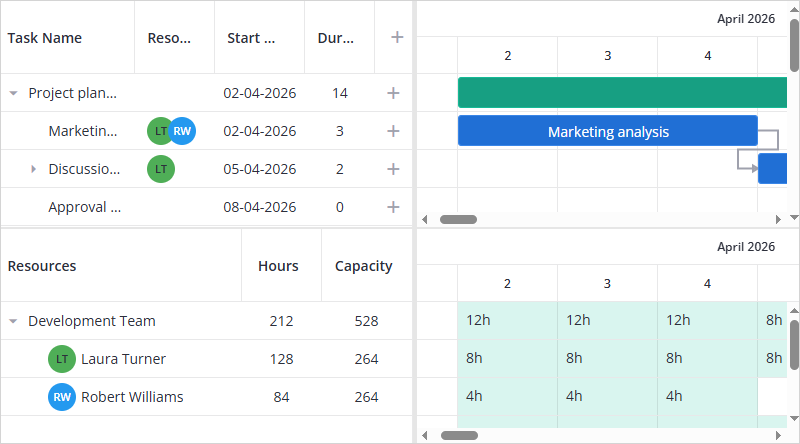
"utilization"(default) — shows allocated hours or percent as numbers in cells, color-coded by load
"histogram"— shows a bar per cell with a capacity line, so overload is visible at a glance
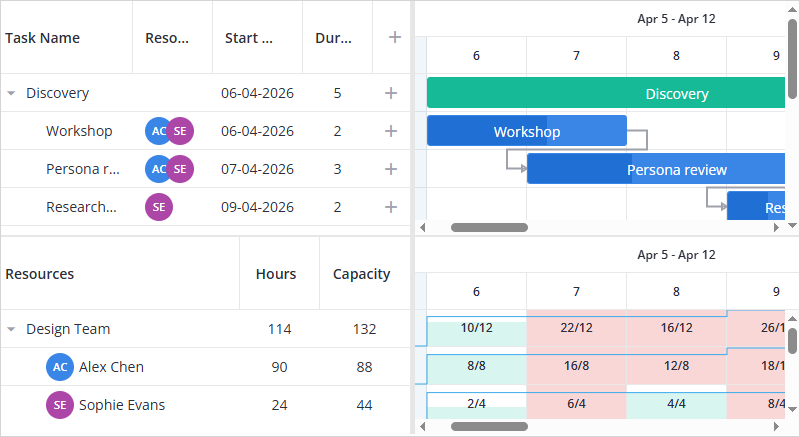
<ResourceLoad :api="api" mode="histogram" />
Configure bar clipping and the capacity line with the histogram prop:
<ResourceLoad
  :api="api"
  mode="histogram"
  :histogram="{
    overloadHeadroom: 1.5,
    capacityLine: false,
  }"
/>
overloadHeadroommultiplies the cell's nominal capacity (working hours per day × days in the cell) to set the upper bound of the bar scale — the point at which a bar is clipped. The default1.25clips at 125% of nominal capacity. If nominal capacity is 0, the upper bound falls back to the capacity line value instead.capacityLineset tofalsehides the capacity line; it's shown by default.
Hovering a bar shows a tooltip reading "{name}: {hours}h / {capacity}h" by default. For a custom tooltip, see Add tooltips in the resource load view.
Resource load with calendars
By default ResourceLoad assumes 8 working hours per day. Pass the calendar prop to Gantt to define the actual working schedule. ResourceLoad uses it to calculate load hours and percentages correctly.
<script setup>
  import { Gantt, ResourceLoad } from "@svar/vue-gantt";
  import { ref } from "vue";

  const calendar = {
    weekHours: {
      monday: 8,
      tuesday: 8,
      wednesday: 8,
      thursday: 8,
      friday: 4,
      saturday: 0,
      sunday: 0,
    },
  };

  const api = ref(null);
</script>

<template>
  <Gantt ref="api" :tasks="tasks" :links="links" :scales="scales" :resources="resources" :assignments="assignments" :calendar="calendar" />
  <ResourceLoad :api="api" />
</template>
With a 4 h Friday, a resource assigned to a full-day task on Friday shows { percent: 100, hours: 4 }, fully loaded at 4 h, not 8 h.
The same calendar setup works with hierarchical resources. To organize resources into teams, set the parent field on each resource. ResourceLoad renders parent rows as collapsible group headers with aggregated load values:
<script setup>
  import { Gantt, ResourceLoad } from "@svar/vue-gantt";
  import { ref } from "vue";

  const resources = [
    { id: "dev", name: "Developers team", open: true },
    { id: "r1", name: "Robert Williams", role: "Developer", color: "#5C6BC0", parent: "dev" },
    { id: "r2", name: "Abram Herwitz",   role: "Developer", color: "#7E57C2", parent: "dev" },
    { id: "qa", name: "QA Team", open: true },
    { id: "r3", name: "James Wilson", role: "QA Engineer", color: "#FF9800", parent: "qa" },
    { id: "r4", name: "Emma Davis",   role: "QA Lead",     color: "#9C27B0", parent: "qa" },
  ];

  const calendar = {
    weekHours: { monday: 8, tuesday: 8, wednesday: 8, thursday: 8, friday: 8, saturday: 0, sunday: 0 },
  };

  const api = ref(null);
</script>

<template>
  <Gantt ref="api" :tasks="tasks" :links="links" :scales="scales" :resources="resources" :assignments="assignments" :calendar="calendar" />
  <ResourceLoad :api="api" :template="v => `${v.hours}h (${v.percent}%)`" />
</template>
Tasks excluded from resource load
Inactive tasks are excluded from resource load calculation. Their resource assignments are kept, but they add no hours to the load.
Related samples:
Related articles: